Employers See More RFEs and Denials, USCIS Data Confirm
February 25, 2019
At a glance
- Between FY 2015 and FY 2018, the rate of approvals fell and the rate of requests for evidence rose for H-1B, L-1, TN and O petitions filed at USCIS Service Centers.
- H-1B employers in the IT consulting industry saw higher than average denial rates, consistent with increasingly stringent policies at USCIS.
- Though the rate of RFEs and denials has been increasing for several immigration categories since the Obama Administration, there was a significant uptick in the wake of the Trump Administration’s Buy American, Hire American executive order.
A closer look
New data from U.S. Citizenship and Immigration Services show declining approvals and higher rates of requests for evidence (RFEs) for several key employer-sponsored nonimmigrant categories, including H-1B and L-1, between FY 2015 and the first quarter of FY 2019.
The new USCIS data reflect adjudication patterns in both the Obama and Trump Administrations. Though RFE and denial rates have increased in several nonimmigrant categories since FY 2015, the greatest increases occurred after the Trump Administration’s Buy American, Hire American executive order, which was issued in April 2017.
H-1B RFEs and outcomes
The overall rate of H-1B approval fell from 95.7% in FY 2015 to 84.5% in FY 2018. The approval rate during the first quarter of FY 2019 was 75.4%. H-1B RFE rates rose from 22.3% in FY 2015 to 38% in FY 2018, and stood at 60% in the first quarter of FY 2019.
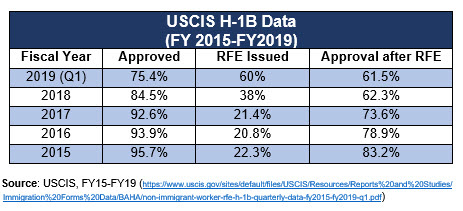
Employers in the IT consulting industry saw higher than average RFE and denial rates, consistent with increasingly stringent agency policies on the H-1B eligibility of certain technology occupations and on third-party placement of H-1B workers.
L-1 Service Center RFEs and outcomes
USCIS approved L-1 petitions at a rate of 77.8% in FY 2018, down from a high of 85% in FY 2016. The approval rate during the first quarter of FY 2019 was 74.4%. The L-1 RFE rate rose from 34.3% in FY 2015 to 45.6% in FY 2018. The RFE rate for the first quarter of FY 2019 was 51.8%.
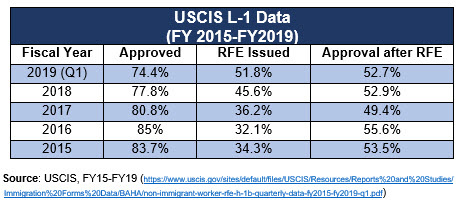
The data released by USCIS do not include adjudication statistics for L-1 applications at U.S. consulates or ports of entry.
TN and O-1/O-2 trends at USCIS
The approval rate for TN petitions filed at a USCIS Service Center fell from 95.1% in FY 2015 to 88.2% in FY 2018, while RFE rates increased from 17.3% in FY 2015 to 28.2% in FY 2018. Approval rates fell more markedly after USCIS restricted use of the TN economist category in December 2017. The data released by USCIS do not include adjudication statistics for TN applications at U.S. ports of entry or consulates.
The approval rate for O-1 and O-2 petitions fell modestly from 92% in FY 2015 to 90.7% in FY 2018. The rate of RFEs increased from 24.9% to 27.8% in the same period.
What the new data mean for employers
The new data from USCIS confirm that, though the majority of H-1B, L-1, TN and O-1/O-2 petitions are ultimately approved, employers face increasing hurdles when petitioning for nonimmigrant employees and must expend more time and resources responding to evidence requests and, for those foreign nationals whose petitions are denied, seeking alternative immigration options.
This alert is for informational purposes only. If you have any questions, please contact the immigration professional with whom you work at Fragomen.


